Use malloc to speed up your code... Wait... What?!
Introduction
This post comes from an experience I had while preparing a course in C++ for internal training in my company.
As part of the course, I wanted to emphasize that one should keep variables as automatic storage duration, and not use dynamic allocations unless necessary.
I often like to show examples of real code to prove my points, usually using online pages like compiler explorer.
Proving a point
I wanted to show the performance impact of using dynamic allocation vs. automatic storage duration. Therefore, I turned to the quick-bench website and quickly authored a very simple example:
struct MyClass
{
  float f;
  int i;
  int j;
};

struct AllocatingStruct
{
  AllocatingStruct() : i(std::unique_ptr<MyClass>(new MyClass)) {}

  std::unique_ptr<MyClass> i;
};

struct NonAllocatingStruct
{
  NonAllocatingStruct() {}
  MyClass i;
};
The benchmark would test the time it would take to instantiate either AllocatingStruct or NonAllocatingStruct.
static void AllocatingStructBM(benchmark::State& state) {
  for (auto _ : state) {
    AllocatingStruct myStruct;
    benchmark::DoNotOptimize(myStruct);
  }
}

static void NonAllocatingStructBM(benchmark::State& state) {
  for (auto _ : state) {
    NonAllocatingStruct myStruct;
    benchmark::DoNotOptimize(myStruct);
  }
}
You might be wondering why I didn’t use std::make_unique to make the unique_ptr. This is because std::make_unique will zero the memory allocated. This is also the reason we have std::make_unique_for_overwrite, which will not zero the memory. So if I had targeted C++20, I would probably have used std::make_unique_for_overwrite.
Automatic allocation will not zero-initialize anything, so to make the comparisons fair, I couldn’t use std::make_unique.
I used DoNotOptimize to make sure myStruct would not be removed by the optimizer.
Running the benchmark gave the following result:
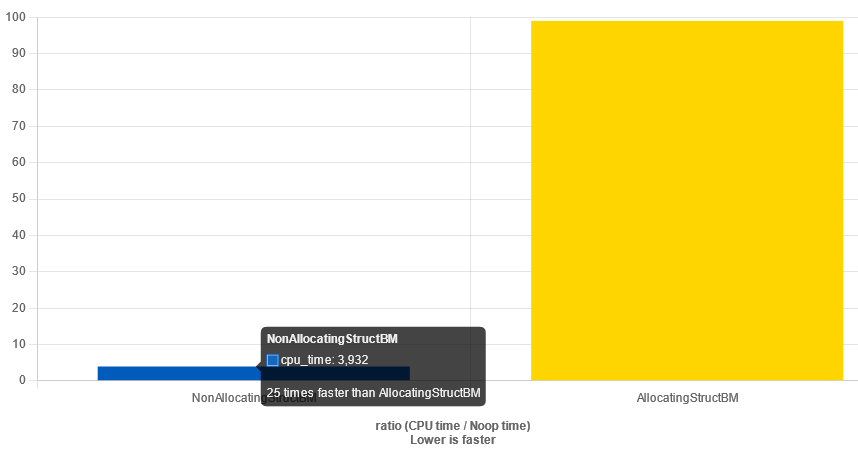
I was delighted to see, that the benchmark correctly proved that using dynamic storage was way more expensive than having a variable with automatic storage duration.
Playing around with allocation sizes
Now, I wanted to show how this worked for different sizes of MyClass. So I made the class a bit bigger:
struct MyClass
{
  float f;
  int i[1024];
  int j;
};
Expecting somewhat the same results, I pressed the “Run Benchmark” button and got…
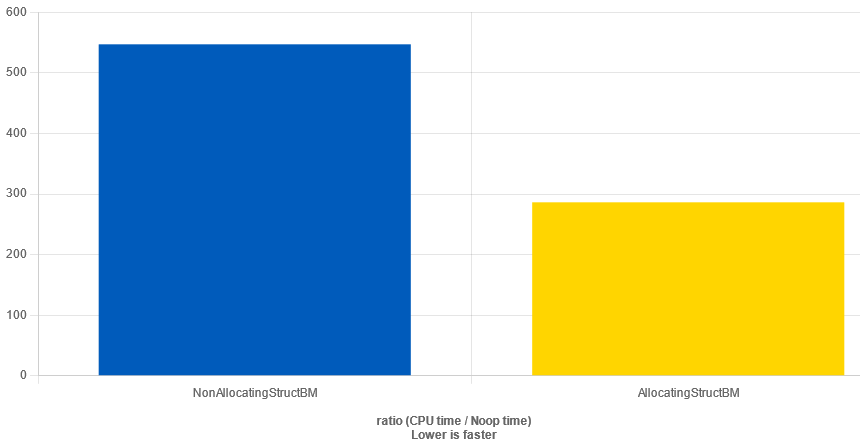
Wait… What!?
In this case, the allocating class was actually faster than the non-allocating.
This makes no sense. Although calls to new can be very fast if we allocate storage that is already “cached” by our memory allocator implementation, surely just using automatic storage must be faster. After all, it should just be increasing a stack pointer.
So what’s going on?
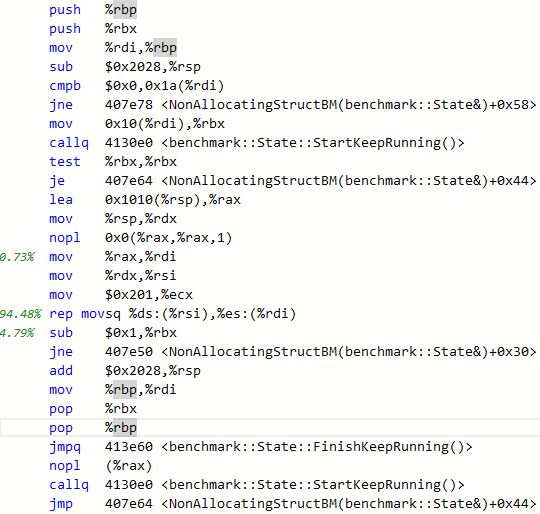
To answer this, we need to look at the assembly for each variant:
| Non-allocating | Allocating |
|---|---|
 |
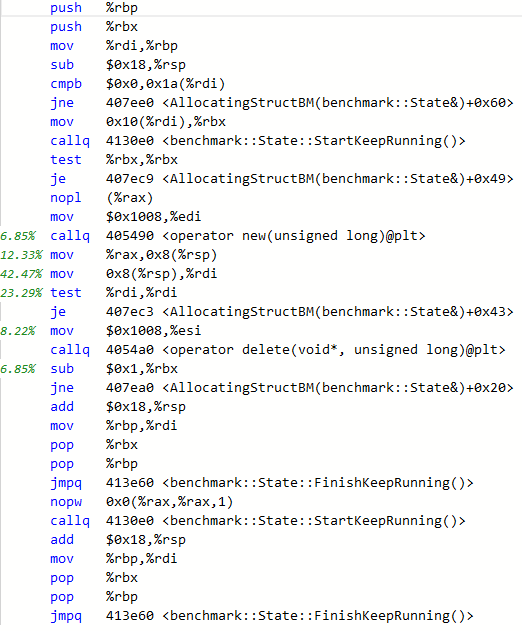 |
At first, I was suspecting the compiler to optimize away the calls to new and delete. But as can be seen from the assembly, this is not the case.
We need to dig a bit deeper into what is taking the time.
In the allocating case, the main time is spent in two mov calls, where we copy the content of rax to the stack, and back again and then a TEST instruction.
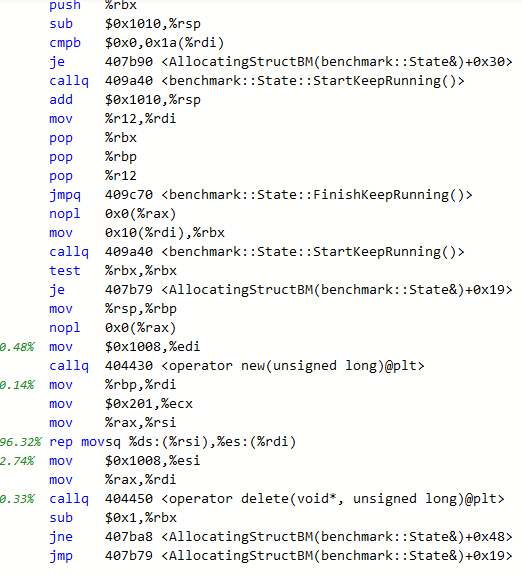
In the non-allocating case, the main time is spent on a REP MOVSQ instruction. In fact, we are moving 0x201 quad-words (4104 bytes) to the stack. This size is exactly the sizeof(MyClass).
The culprit is, as you might have guessed, the call to DoNotOptimize(). Which somehow forces the variable in question to be copied to the stack. Indeed, in the allocating case, the contents of the unique_ptr (one pointer) is also copied to the stack. But this is much cheaper than copying the full struct.
To make a fair comparison, we need to use the following code:
static void AllocatingStructBM(benchmark::State& state) {
  for (auto _ : state) {
    AllocatingStruct myStruct;
    benchmark::DoNotOptimize(*myStruct.i);
  }
}
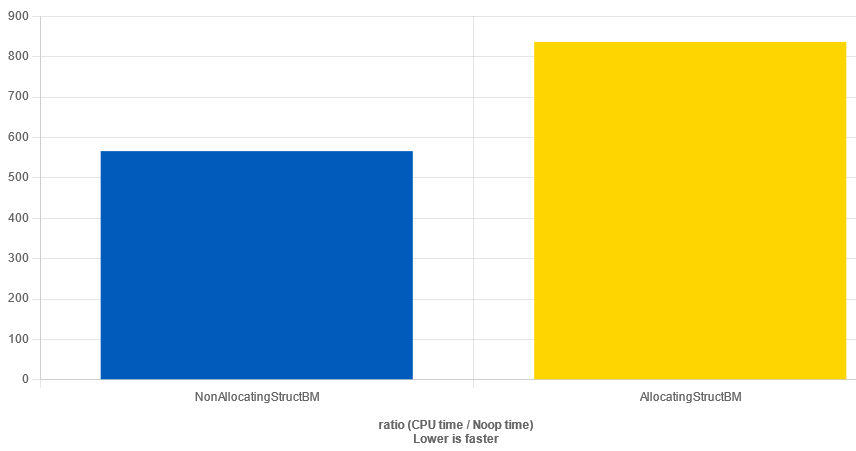
And in this case, as expected, the allocating case is slower than the non-allocating
And the assembly contains the same REP MOVSQ instruction:
Sanity is restored…
Story is not over
Now, the story is not quite over yet. I have tried to recreate the results i found in quick-bench in Compiler Explorer, and on my local PC.
Even with the same compiler version and compilation settings, and the same source, I cannot recreate the case where the non-allocating case is slower than the allocating case. Even when using DoNotOptimize(). In these cases, the non-allocating case is basically an empty loop (which it should be).
The issue is also only when using GCC. Clang doesn’t have this issue.
I have had a bit of a look into how quick-bench does its benchmarks, and it uses docker containers for building and running the benchmarks. The images for all the different compilers can be found here. Spawning one of these containers and building the code found in the compiler explorer link above will give the same results as I have seen here.
After some investigation, I found out, that the difference is the version of google-benchmark used. Versions prior to 1.6.2 had the issue where memory is copied. This is due to this bug.
If choosing a version of google-benchmark lower than 1.6.2, I can recreate the results I got in compiler-explorer.
Conclusion
There is not much of a conclusion other than the fact that “benchmarking is hard to get right”. Don’t trust synthetic benchmarks, and make sure that what you are benchmarking is actually what you mean to be benchmarking.